Label only the last point(s) on a plot. geom_text_lastonly_repel() can be
used instead of ggplot2::geom_text() when only the last point(s)
should be labeled. This is accomplished by identifying the maximum value of
x in data and applying a filter to omit records where x
is less than the maximum.
geom_text_lastonly_repel(
  mapping = NULL,
  data = NULL,
  stat = "identity",
  position = NULL,
  parse = FALSE,
  box.padding = 0.25,
  point.padding = 1e-06,
  min.segment.length = 0.5,
  arrow = NULL,
  force = 1,
  force_pull = 1,
  max.time = 0.5,
  max.iter = 10000,
  max.overlaps = getOption("ggrepel.max.overlaps", default = 10),
  nudge_x = 0.4,
  nudge_y = 0,
  xlim = c(NA, NA),
  ylim = c(NA, NA),
  na.rm = FALSE,
  direction = c("y", "x", "both"),
  seed = NA,
  verbose = FALSE,
  show.legend = FALSE,
  inherit.aes = TRUE,
  add_points = FALSE,
  text_aes = NULL,
  point_aes = NULL,
  ...
)
Arguments
- mapping
Set of aesthetic mappings created by
aesoraes_. If specified andinherit.aes = TRUE(the default), is combined with the default mapping at the top level of the plot. You only need to supplymappingif there isn't a mapping defined for the plot.- data
A data frame. If specified, overrides the default data frame defined at the top level of the plot.
- stat
The statistical transformation to use on the data for this layer, as a string.
- position
Position adjustment, either as a string, or the result of a call to a position adjustment function.
- parse
If TRUE, the labels will be parsed into expressions and displayed as described in ?plotmath
- box.padding
Amount of padding around bounding box, as unit or number. Defaults to 0.25. (Default unit is lines, but other units can be specified by passing
unit(x, "units")).- point.padding
Amount of padding around labeled point, as unit or number. Defaults to 0. (Default unit is lines, but other units can be specified by passing
unit(x, "units")).- min.segment.length
Skip drawing segments shorter than this, as unit or number. Defaults to 0.5. (Default unit is lines, but other units can be specified by passing
unit(x, "units")).- arrow
specification for arrow heads, as created by
arrow- force
Force of repulsion between overlapping text labels. Defaults to 1.
- force_pull
Force of attraction between a text label and its corresponding data point. Defaults to 1.
- max.time
Maximum number of seconds to try to resolve overlaps. Defaults to 0.5.
- max.iter
Maximum number of iterations to try to resolve overlaps. Defaults to 10000.
- max.overlaps
Exclude text labels when they overlap too many other things. For each text label, we count how many other text labels or other data points it overlaps, and exclude the text label if it has too many overlaps. Defaults to 10.
- nudge_x, nudge_y
Horizontal and vertical adjustments to nudge the starting position of each text label. The units for
nudge_xandnudge_yare the same as for the data units on the x-axis and y-axis.- xlim, ylim
Limits for the x and y axes. Text labels will be constrained to these limits. By default, text labels are constrained to the entire plot area.
- na.rm
If
FALSE(the default), removes missing values with a warning. IfTRUEsilently removes missing values.- direction
"both", "x", or "y" – direction in which to adjust position of labels
- seed
Random seed passed to
set.seed. Defaults toNA, which means thatset.seedwill not be called.- verbose
If
TRUE, some diagnostics of the repel algorithm are printed- show.legend
logical. Should this layer be included in the legends?
NA, the default, includes if any aesthetics are mapped.FALSEnever includes, andTRUEalways includes.- inherit.aes
If
FALSE, overrides the default aesthetics, rather than combining with them. This is most useful for helper functions that define both data and aesthetics and shouldn't inherit behaviour from the default plot specification, e.g.borders.- add_points
If
TRUE, points will be added to the plot (for the labeled data only). Default size=2, color will match line color.- text_aes, point_aes
Named list, additional aesthetics to send to the text and point geoms, respectively.
- ...
Additional aesthetics to send to BOTH the point and text geoms. Note that if
add_points = FALSE, additional parameters can be passed to the text geom here, rather than intext_aes, without breaking.
Details
Labels are placed by default to the right of the final point, and may be partially cut off by the plot limits. There are two known ways to address this:
Turn off panel clipping, e.g. with
coord_cartesian(clip = "off"). Substitute the correct coordinate system for your plot–all have aclipargument available. Note that this will allow all geoms in the plot to draw outside the panel area, which may have unintended consequences.Manually expand the
xscale, e.g. withscale_x_continuous(expand=expand_scale(mult=0.10))orcoord_cartesian(xlim = c(min, max)).
Code was mostly copied from the source of ggrepel::geom_text_repel() and
ggplot2::geom_point().
Alignment with hjust or vjust
The arguments hjust and vjust are supported, but they only
control the initial positioning, so repulsive forces may disrupt alignment.
Alignment with hjust will be preserved if labels only move up and down
by using direction="y". For vjust, use direction="x".
Examples
library(tidyverse)
#> ── Attaching core tidyverse packages ──────────────────────── tidyverse 2.0.0 ──
#> ✔ dplyr 1.1.4 ✔ readr 2.1.6
#> ✔ forcats 1.0.1 ✔ stringr 1.6.0
#> ✔ lubridate 1.9.4 ✔ tibble 3.3.0
#> ✔ purrr 1.2.0 ✔ tidyr 1.3.1
#> ── Conflicts ────────────────────────────────────────── tidyverse_conflicts() ──
#> ✖ dplyr::filter() masks stats::filter()
#> ✖ dplyr::lag() masks stats::lag()
#> ℹ Use the conflicted package (<http://conflicted.r-lib.org/>) to force all conflicts to become errors
df <- transit_ridership %>%
filter(system != "pace_ada") %>%
mutate(system = recode_factor(system,
cta_bus = "CTA bus",
cta_rail = "CTA rail",
metra = "Metra",
pace = "Pace"))
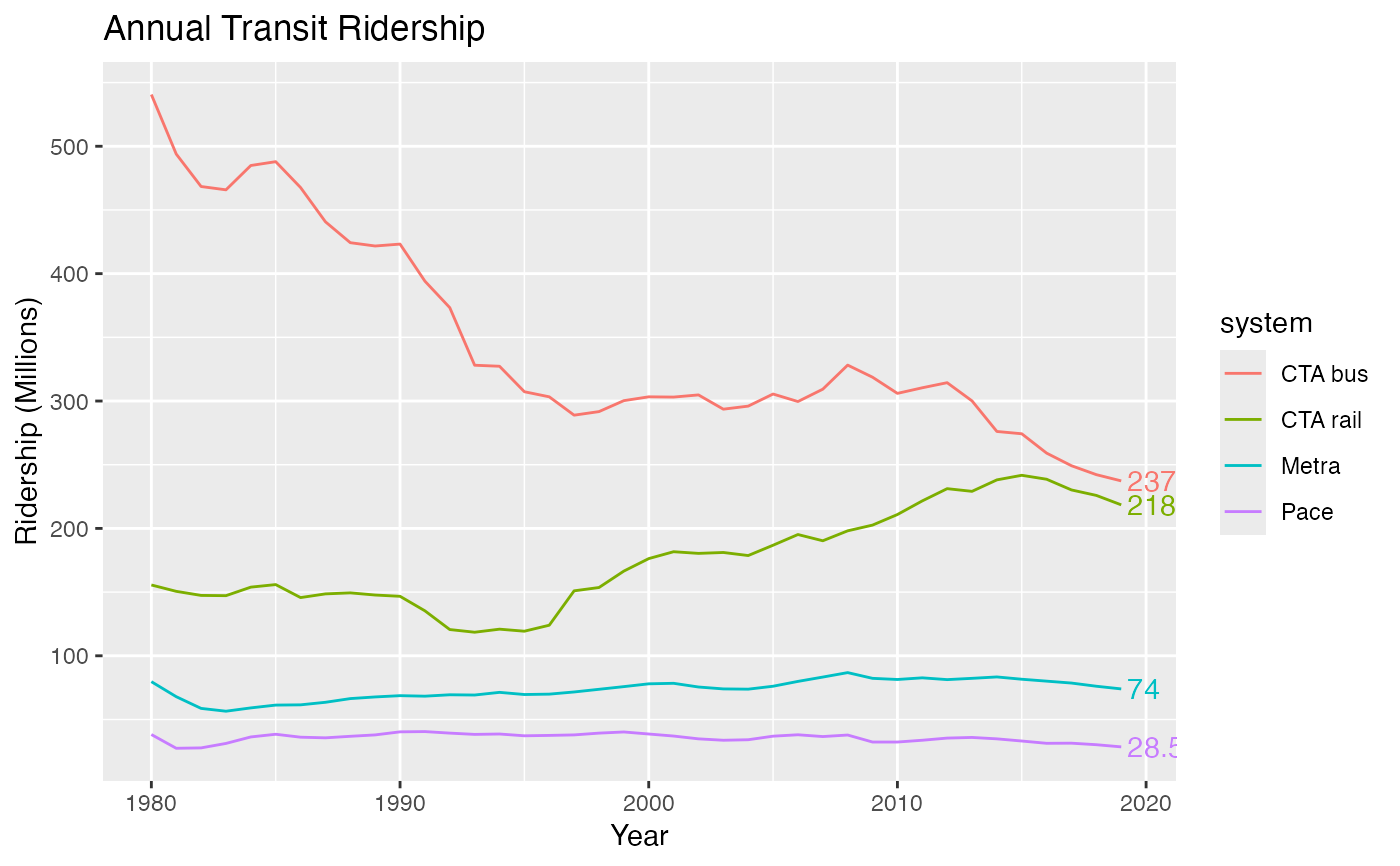
# Without points, label formatting or x-axis expansion
ggplot(df, aes(x = year, y = ridership, color = system)) +
geom_line() +
labs(title = "Annual Transit Ridership") +
scale_y_continuous("Ridership (Millions)") +
scale_x_continuous("Year") +
geom_text_lastonly()