A test dataset containing the percentage breakdowns of the working population employed in traded clusters, by race.
traded_emp_by_raceFormat
A tibble. 12 rows and 4 variables:
- Race
Chr. White, Asian, Hispanic, Other, Black, or Regional Average.
- variable
Chr. SpecializedTraded, UnspecializedTraded, or Total. Total is a sum of SpecializedTraded and UnspecializedTraded. The invisible remainder (e.g. `1-Total` or `1-(SpecializedTraded+UnspecializedTraded)`) is the percentage employed in local clusters.
- value
Double. The value indicated by the other variables.
Source
CMAP traded clusters report
Examples
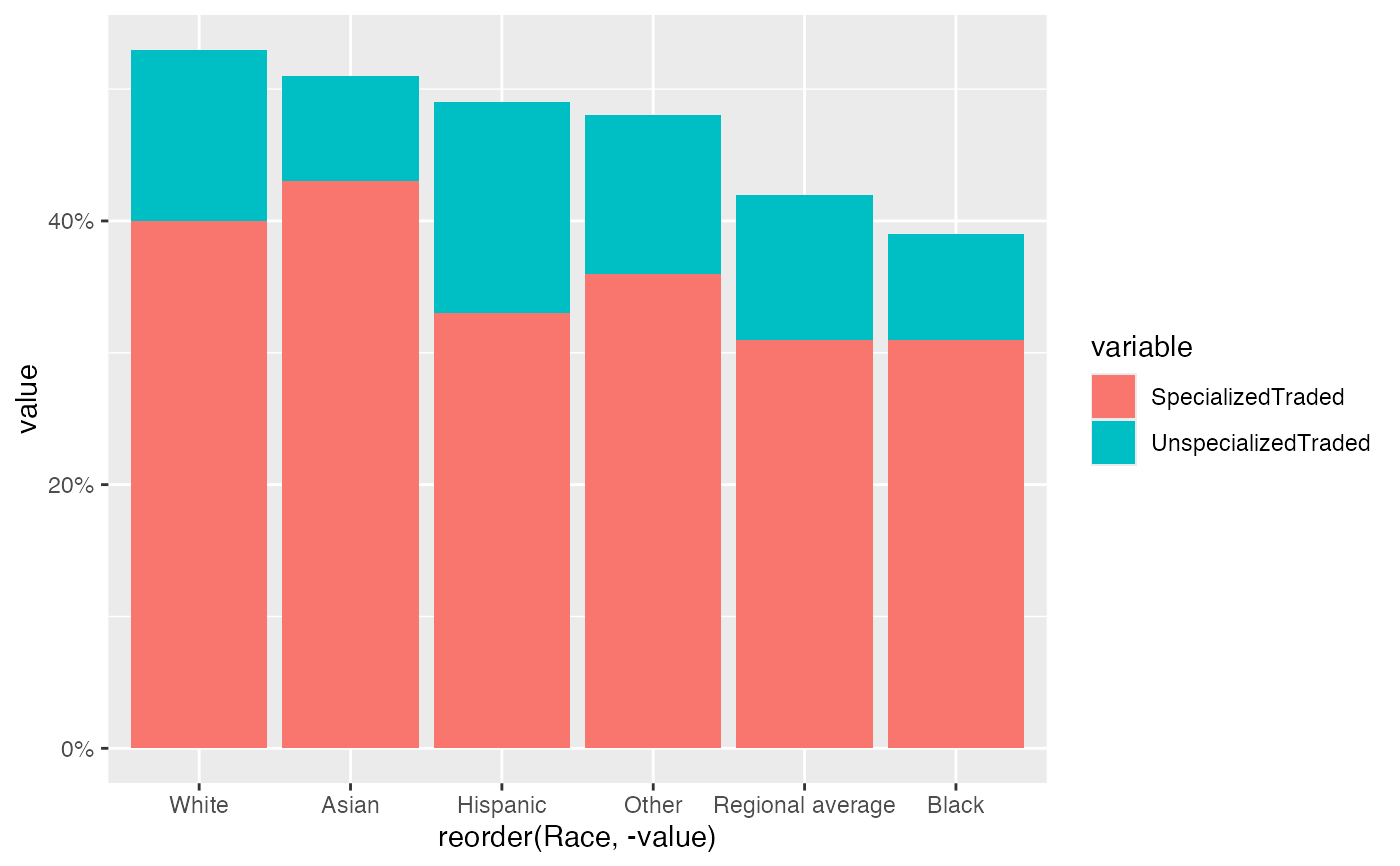
# a stacked bar chart
df <- dplyr::filter(
  traded_emp_by_race,
  variable %in% c("SpecializedTraded", "UnspecializedTraded")
)
ggplot(df, aes(x = reorder(Race, -value), y = value, fill = variable)) +
  geom_col(position = position_stack(reverse = TRUE)) +
  scale_y_continuous(labels = scales::percent)