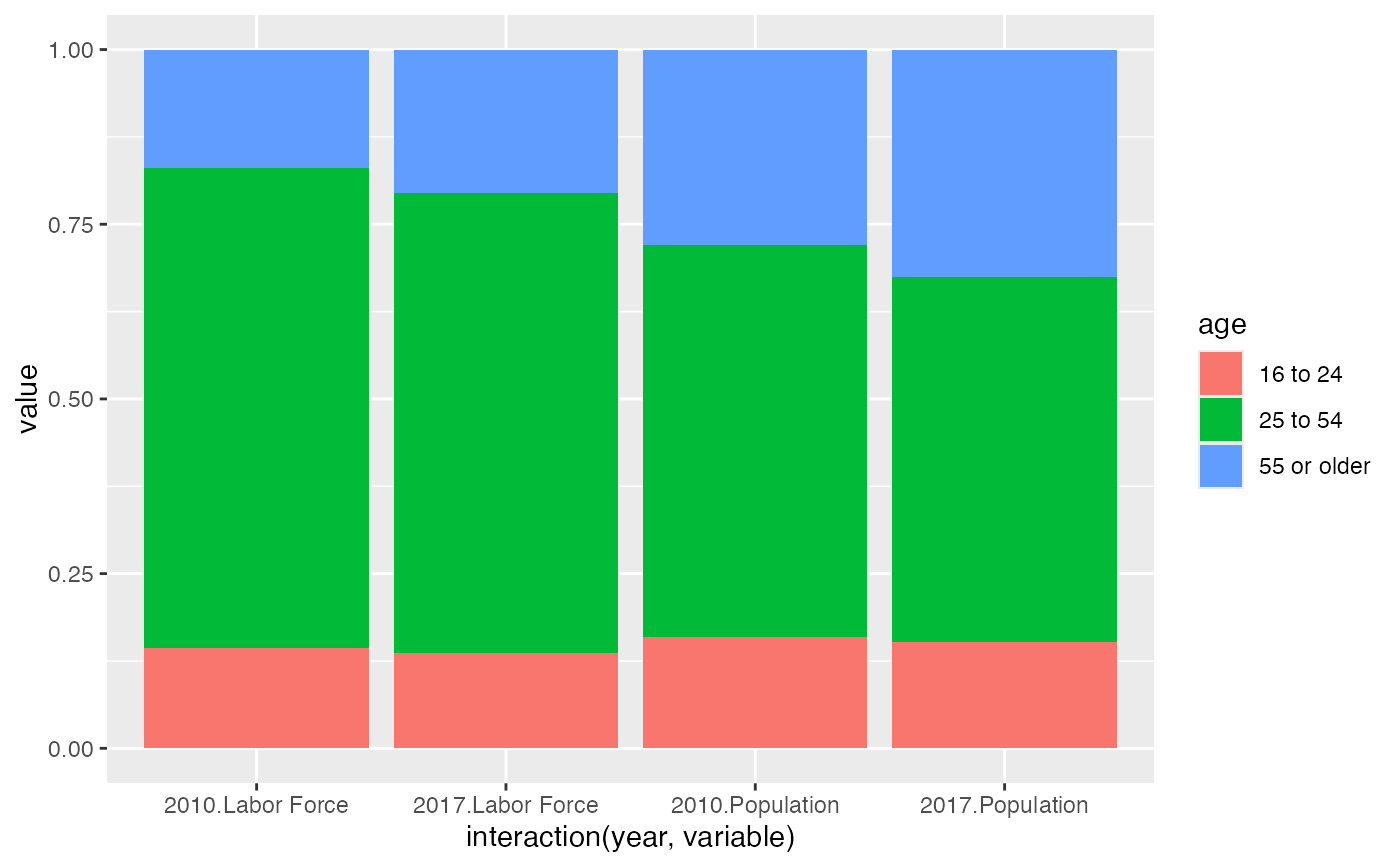
A test dataset containing percentage breakdowns of the population and labor force by various age buckets in 2010 and 2017.
pop_and_laborforce_by_ageFormat
A tibble. 12 rows and 4 variables:
- variable
Chr. Indicates the meaning of the data stored in `value`. "population" or "laborforce".
- year
Factor. 2010 or 2017.
- age
Chr. The age bucket. Either 16-24, 25-54, or 55+.
- value
Double. The value indicated by the other variables.
Source
CMAP traded clusters report
Examples
# a grouped and stacked bar chart (via `interaction()`)
ggplot(pop_and_laborforce_by_age, aes(x = interaction(year, variable), y = value, fill = age)) +
  geom_col(position = position_stack(reverse = TRUE))