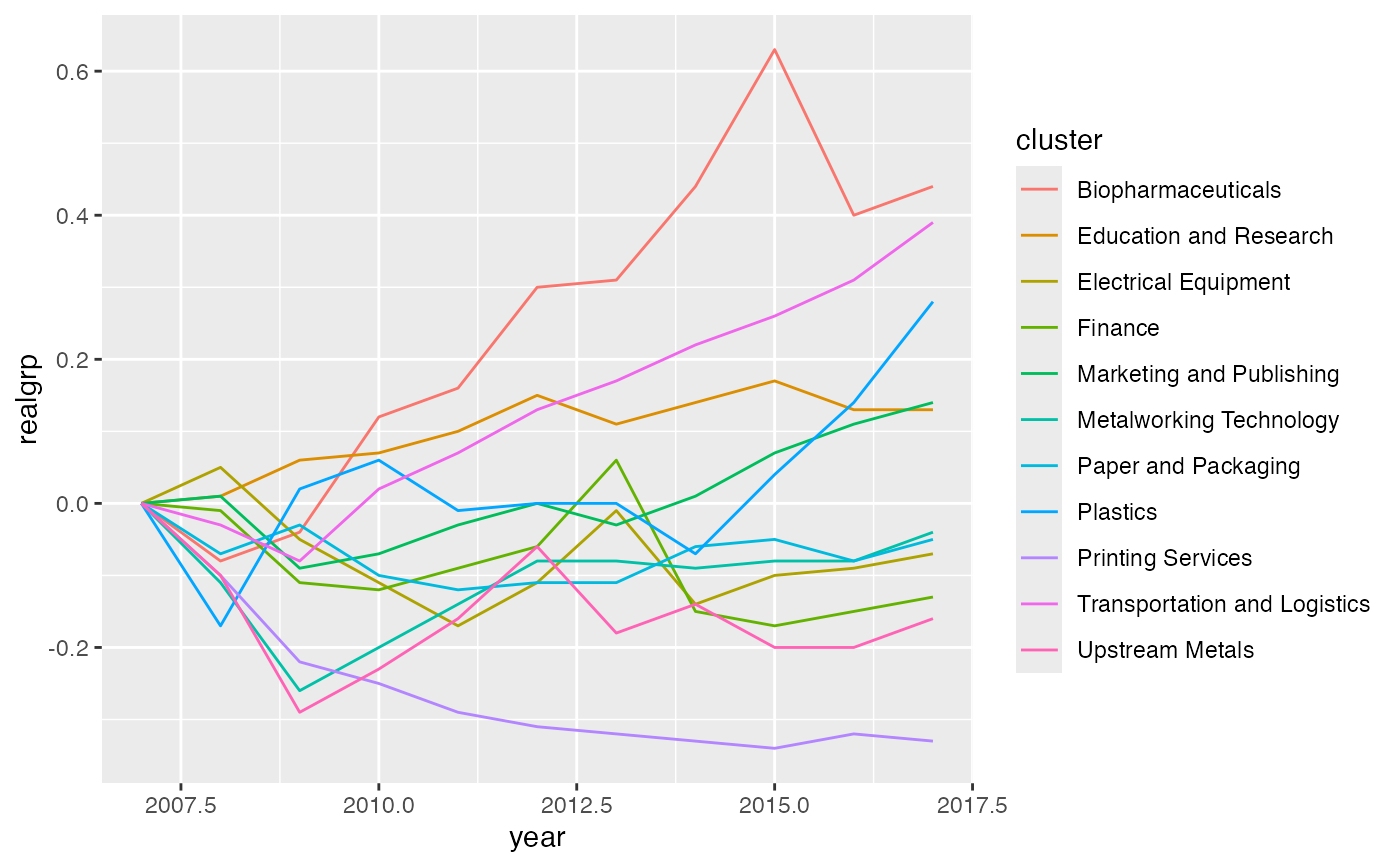
A test dataset containing real GRP data for the CMAP region.
grp_over_timeFormat
A tibble. 121 rows and 5 variables:
- cluster
Chr. The name of the cluster
- category
Factor. "goods-producing" or "services"
- assessment
Factor. "Trailing", "Mixed", or "Leading"
- year
Double. The year of the data
- realgrp
Double. The real gross regional product of the cluster in year `year`. Not exactly sure on the inflation year but I believe it is 2012
Source
CMAP traded clusters report