A test dataset containing count of jobs, earnings, and establishments in the Chicago region in both 2001 and 2017.
economy_basicFormat
A tibble. 18 rows and 4 variables:
- variable
Chr. Indicates the meaning of the data stored in `value`. Jobs, Real Earnings, or Establishments.
- year
Factor. 2001 or 2017.
- sector
Chr. local, tradedgoods, or tradedservices. Together, these three sectors account for all clusters in the region.
- value
Int. The value indicated as described by the other columns
Source
CMAP traded clusters report
Examples
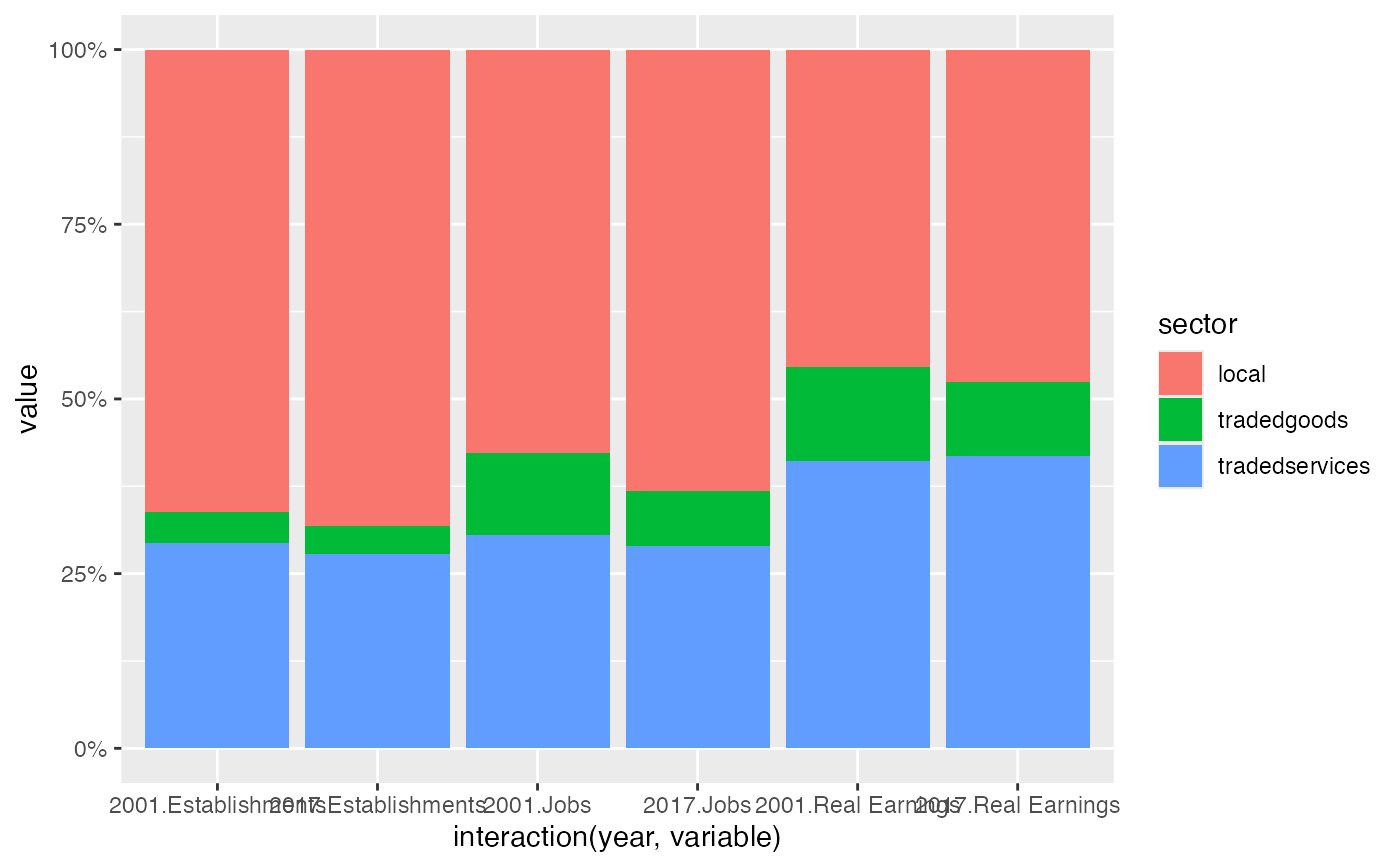
# a grouped and stacked bar chart (via `interaction()`)
ggplot(economy_basic, aes(x = interaction(year, variable), y = value, fill = sector)) +
  geom_col(position = "fill") +
  scale_y_continuous(labels = scales::percent)