Highlight one or more discrete groups in a comparison graph
Source:R/colors_highlight.R
cmap_fill_highlight.RdPick the function depending on the aesthetic of your ggplot object (fill or color). Specify the unique factor name(s) of the group(s) you're highlighting (as a case-sensitive string), and the vector it's found in.
cmap_fill_highlight(
  field,
  value,
  color_value = "#008FD5",
  color_other = "#b0bdcf"
)

cmap_color_highlight(
  field,
  value,
  color_value = "#008FD5",
  color_other = "#b0bdcf"
)

cmap_colour_highlight(
  field,
  value,
  color_value = "#008FD5",
  color_other = "#b0bdcf"
)
Arguments
- field
character vector, the vector in which the value to highlight is found. Values need not be unique. Typically, pass the table column that defines the color/fill aesthetic as 'table$field'
- value
character string or vector, the name of group(s) to highlight
- color_value
Specify the highlight color(s). Default is #00b0f0 (blue)
- color_other
Specify non-highlighted color. Default is #b0bdcf (gray)
Details
You may specify multiple groups to highlight. If you do, you may specify a single highlight color, or a vector of highlight colors of equal length to the vector of highlight values.
This function does not make any modifications to the legend, so legend behavior is not perfect out-of-the-box. For example, if the plot aesthetic differentiates between five unique values, all five values will appear in the legend, even though four use the same color. You will likely want to hide the legend altogether, or manufacture a new data field that contains only the value(s) to highlight and some generic "Other" label.
Functions
cmap_fill_highlight(): For fill aestheticcmap_color_highlight(): For color aestheticcmap_colour_highlight(): For color aesthetic, if you're British
Examples
p <- ggplot(data = dplyr::filter(transit_ridership, year=="2019"),
mapping = aes(x = system, y = ridership, fill = system)) +
geom_col()
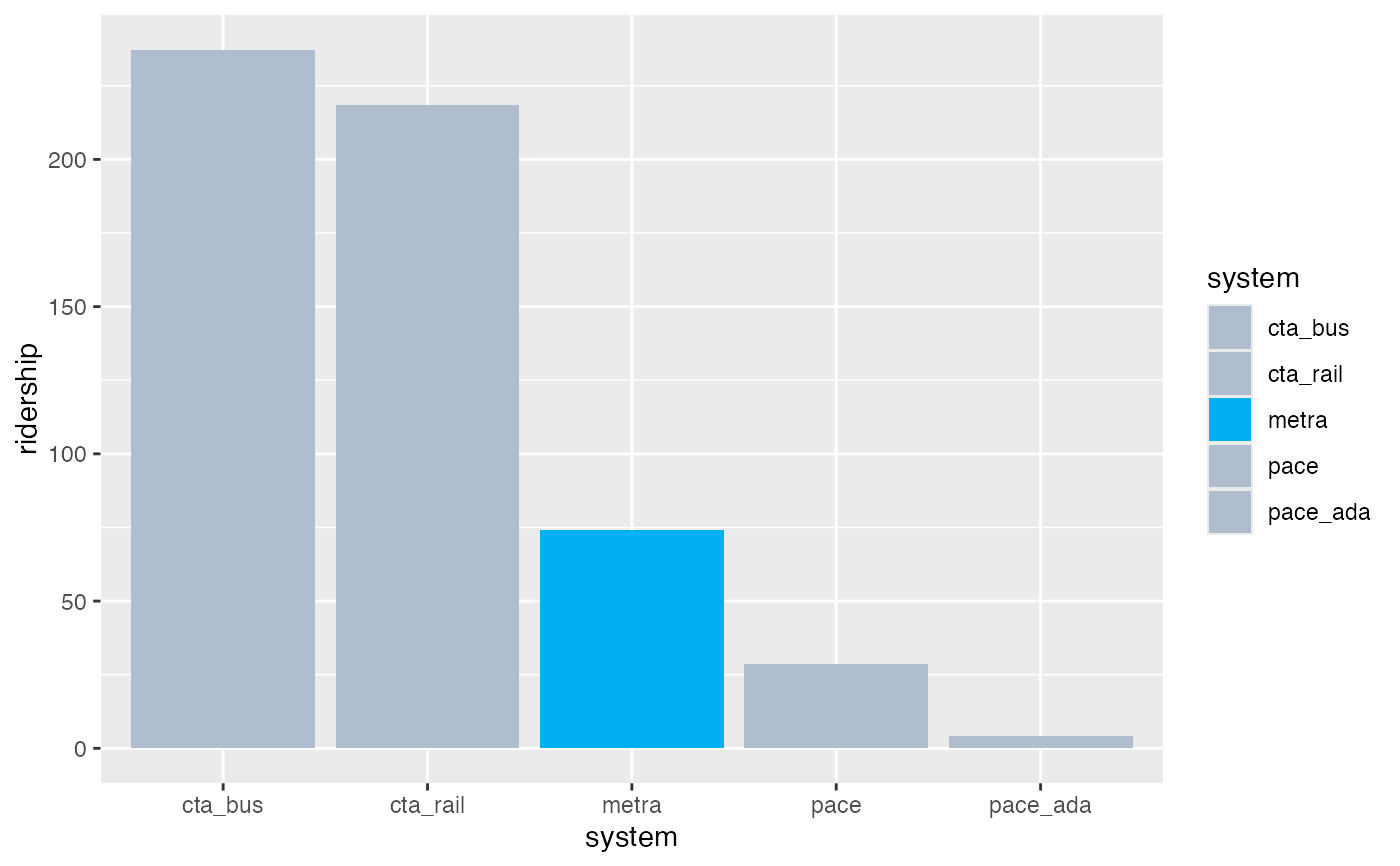
# one value, default colors
p + cmap_fill_highlight(field = transit_ridership$system,
value = "metra")
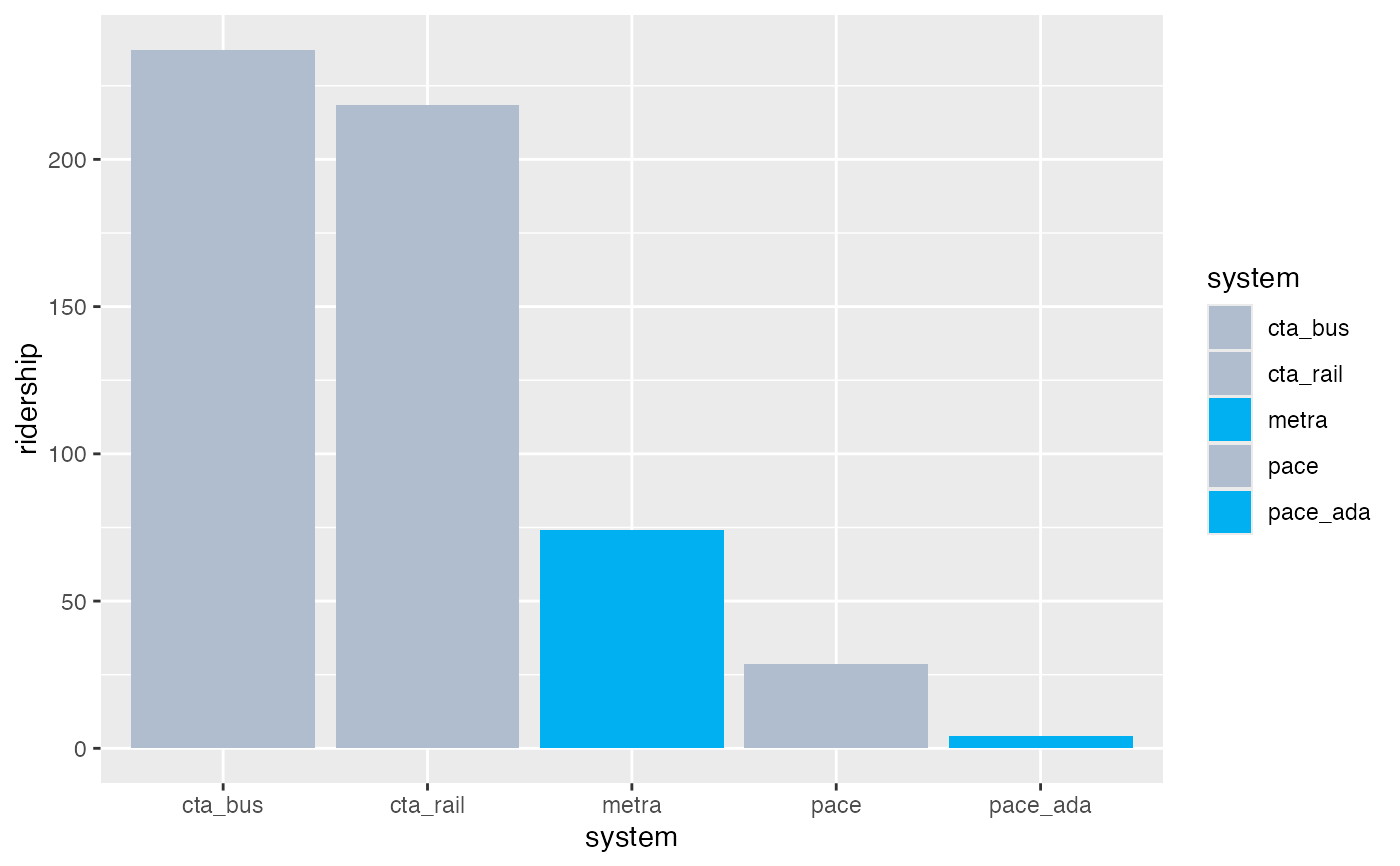
 # multiple values, default colors
p + cmap_fill_highlight(field = transit_ridership$system,
value = c("metra", "pace_ada"))
# multiple values, default colors
p + cmap_fill_highlight(field = transit_ridership$system,
value = c("metra", "pace_ada"))
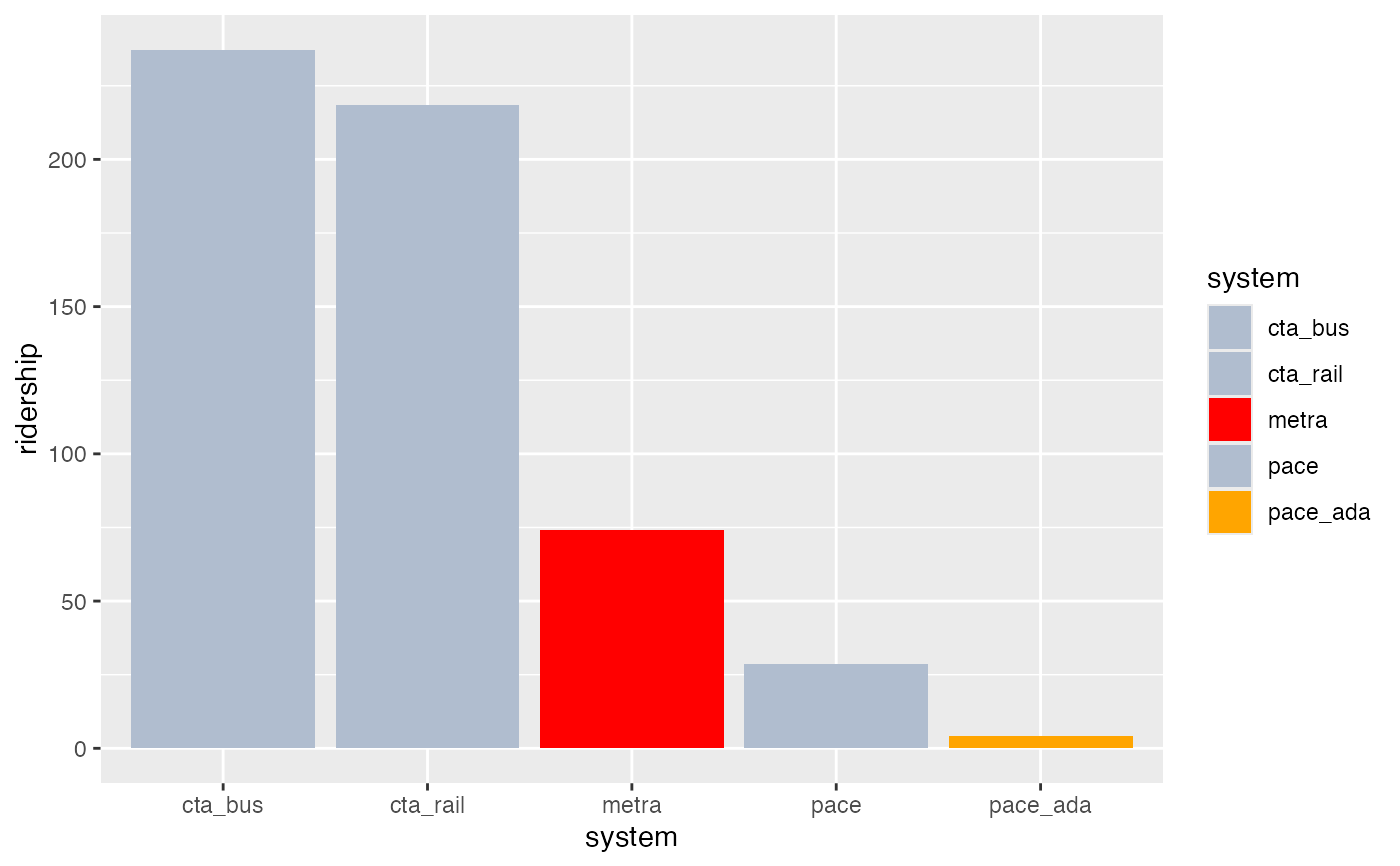
 # multiple values, multiple colors
p + cmap_fill_highlight(
field = transit_ridership$system,
value = c("metra", "pace_ada"),
color_value = c("red", "orange")
)
# multiple values, multiple colors
p + cmap_fill_highlight(
field = transit_ridership$system,
value = c("metra", "pace_ada"),
color_value = c("red", "orange")
)