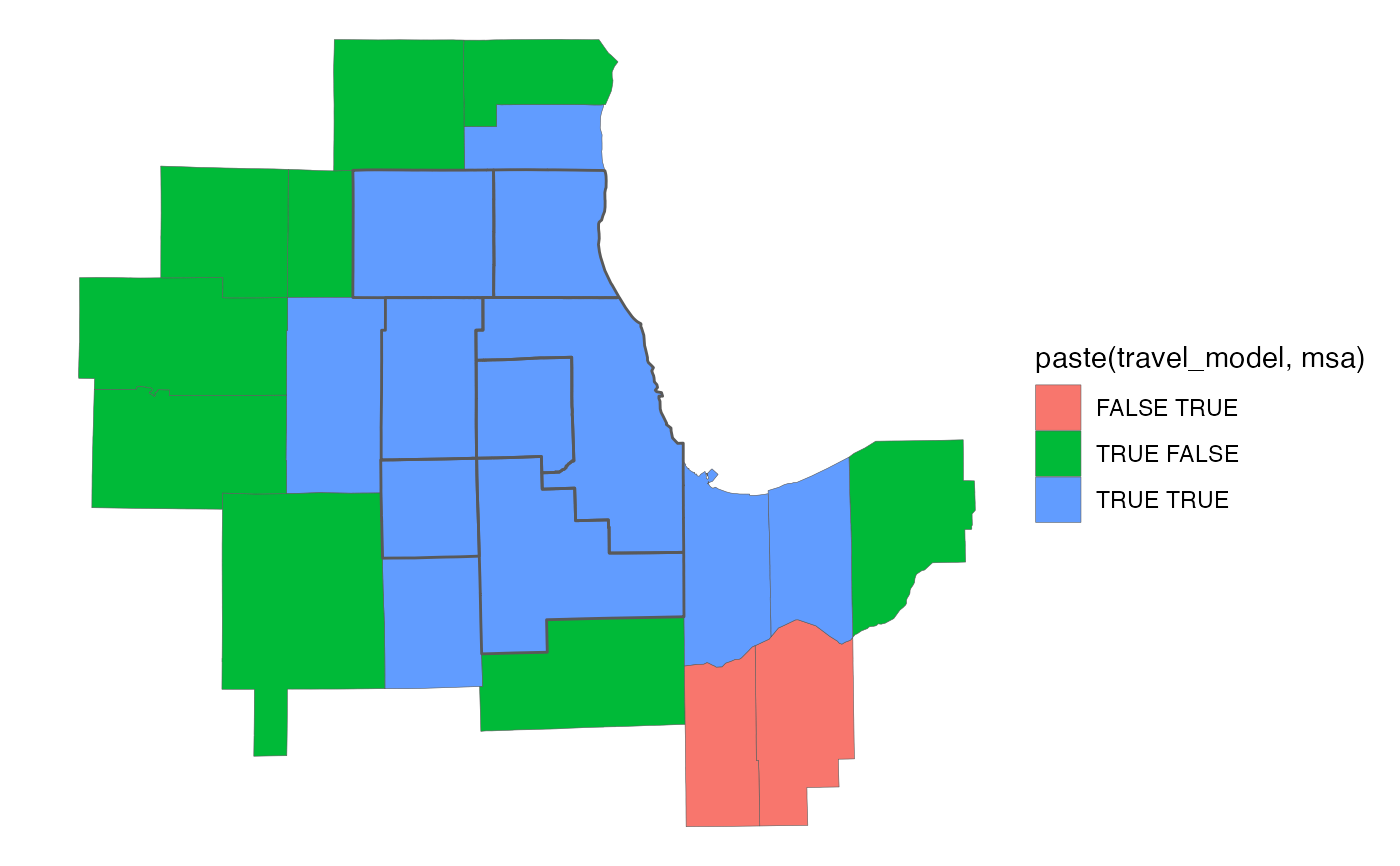
The counties that are within the CMAP travel modeling area or the "Chicago-Naperville-Elgin, IL-IN-WI" Metropolitan Statistical Area (as defined by the United States Office of Management and Budget). From the US Census Bureau's TIGER/Line shapefiles, 2023 vintage.
county_sfFormat
A polygon sf object with 23 rows and
8 variables:
- geoid_county
Unique 5-digit county ID (a.k.a. FIPS code), assigned by the Census Bureau. Character.
- county
County name. Character.
- state
2-letter state abbreviation. Character.
- cmap
Is the county part of the 7-county CMAP region? Logical.
- msa
Is the county part of the "Chicago-Naperville-Elgin, IL-IN-WI" Metropolitan Statistical Area? Logical.
- travel_model
Is the county at least partially covered by CMAP's travel modeling area? Logical.
- sqmi
Area in square miles. Double.
- geometry
Feature geometry.
sfpolygon.
Source
US Census Bureau TIGER/Line
Details
Census Bureau description:
"The primary legal divisions of most states are termed counties. Each county or statistically equivalent entity is assigned a three-character numeric Federal Information Processing Series (FIPS) code based on alphabetical sequence that is unique within state, and an eight-digit National Standard (NS) code."
Note: The Illinois counties of LaSalle, Lee and Ogle are included in their
entirety, although only portions of these counties are part of the CMAP
travel modeling area. The precise geographic extent of the CMAP travel
modeling area is reflected in zone_sf and subzone_sf.
